|
| Strengthening Our Internal Structure |
Strengthening our Internal Structure Our
traditional backbone information system was plagued by a host of problems
that included poor compatibility with the Internet, slow information processing
speeds, and high costs of storage capacity. Determined to eliminate these
problems, in April 2002 Yamato Transport rebuilt its information network
into an open system that operates 24 hours a day, has a large-volume database,
and eliminates restrictions on product and service-related information.
This new system is expected to play a key role in allowing us to better
respond to customer needs. Our
traditional backbone information system was plagued by a host of problems
that included poor compatibility with the Internet, slow information processing
speeds, and high costs of storage capacity. Determined to eliminate these
problems, in April 2002 Yamato Transport rebuilt its information network
into an open system that operates 24 hours a day, has a large-volume database,
and eliminates restrictions on product and service-related information.
This new system is expected to play a key role in allowing us to better
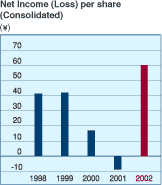
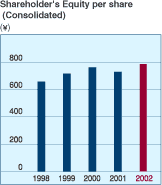
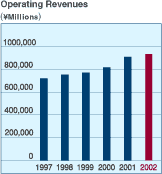
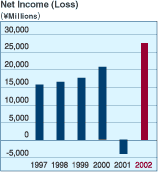
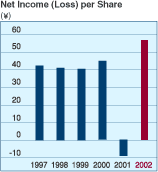
respond to customer needs.Buyback of Company Stock As one effective use of cash, Yamato Transport announced a buyback of 4.5 million Company shares at a cost of ¥10 billion. This buyback resulted in a decrease in the total number of shares issued by the Company as well as an accompanying decline in shareholders’ equity. As a result, income per share and ROE rose, contributing to an increase in shareholder value. |
|||||
 |
 |
 |
Fortifying Our Sales Network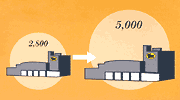 Within
a ten-year period, we are planning to open a large number of small-sized
sales outlets, thus expanding our network of outlets from 2,800 at present,
to 5,000. By increasing the size of our network in this manner, we will
be better able to propose more convenient and pleasant lifestyles to consumers.
Although there is a possibility this will lead to higher overall rental
costs, we are making our best efforts to maintain capital efficiency through
measures such as switching away from the use of high-rent buildings leased
during the era of Japan's bubble economy to lower rent facilities, as well
as improving efficiency by taking such steps as consolidating business affairs
and striving to minimize costs. Within
a ten-year period, we are planning to open a large number of small-sized
sales outlets, thus expanding our network of outlets from 2,800 at present,
to 5,000. By increasing the size of our network in this manner, we will
be better able to propose more convenient and pleasant lifestyles to consumers.
Although there is a possibility this will lead to higher overall rental
costs, we are making our best efforts to maintain capital efficiency through
measures such as switching away from the use of high-rent buildings leased
during the era of Japan's bubble economy to lower rent facilities, as well
as improving efficiency by taking such steps as consolidating business affairs
and striving to minimize costs. |
|||||
| Fortifying Our Service for Customers and Shippers |
Fortifying the Quality of Our
Deliveries As
both a pioneer in the parcel delivery industry as well as a market leader,
Yamato Transport boasts an approximately 35% share of the entire parcel
delivery market. The approximately 40,000 drivers who deliver parcels cover
46,000 million households, or 1,150 households per driver. Drivers are assigned
specific areas, allowing them to establish bonds of trust with customers,
a feature of our operations that distinguishes us from our competitors.
The enhanced quality of this parcel delivery service is the wellspring of
Yamato Transport’s competitiveness as well as an ongoing theme of the
Company’s operations. As
both a pioneer in the parcel delivery industry as well as a market leader,
Yamato Transport boasts an approximately 35% share of the entire parcel
delivery market. The approximately 40,000 drivers who deliver parcels cover
46,000 million households, or 1,150 households per driver. Drivers are assigned
specific areas, allowing them to establish bonds of trust with customers,
a feature of our operations that distinguishes us from our competitors.
The enhanced quality of this parcel delivery service is the wellspring of
Yamato Transport’s competitiveness as well as an ongoing theme of the
Company’s operations.Developing Products and Enhancing Services to Respond to the Age of IT  Yamato
Transport has developed new products and enhanced its services in tandem
with advances in IT. While basing its operations on the consumer-to-consumer
(C2C) market, Yamato Transport is upgrading its services that utilize IT
in all business-to-consumer (B2C) fields. During the fiscal year under review,
we launched a TA-Q-BIN e-mail notification service that notifies
customers of delivery dates and times as well as allows customers to change
delivery dates and times. Yamato
Transport has developed new products and enhanced its services in tandem
with advances in IT. While basing its operations on the consumer-to-consumer
(C2C) market, Yamato Transport is upgrading its services that utilize IT
in all business-to-consumer (B2C) fields. During the fiscal year under review,
we launched a TA-Q-BIN e-mail notification service that notifies
customers of delivery dates and times as well as allows customers to change
delivery dates and times. |
|||||
|
|
||||||||||||||||||||||||||||||||||||||||||||||||||||||||||||||||||||||||||||||||||||||||||||||||||||||||||
| Note: U.S. dollar amounts have been translated, for convenience only, at the rate of ¥133 to US$1. | |
 |
 |
 |